|
Farshid Abdi Assistant Professor of Finance |
E-mail: fabdi@mays.tamu.edu |
Research
Published Papers
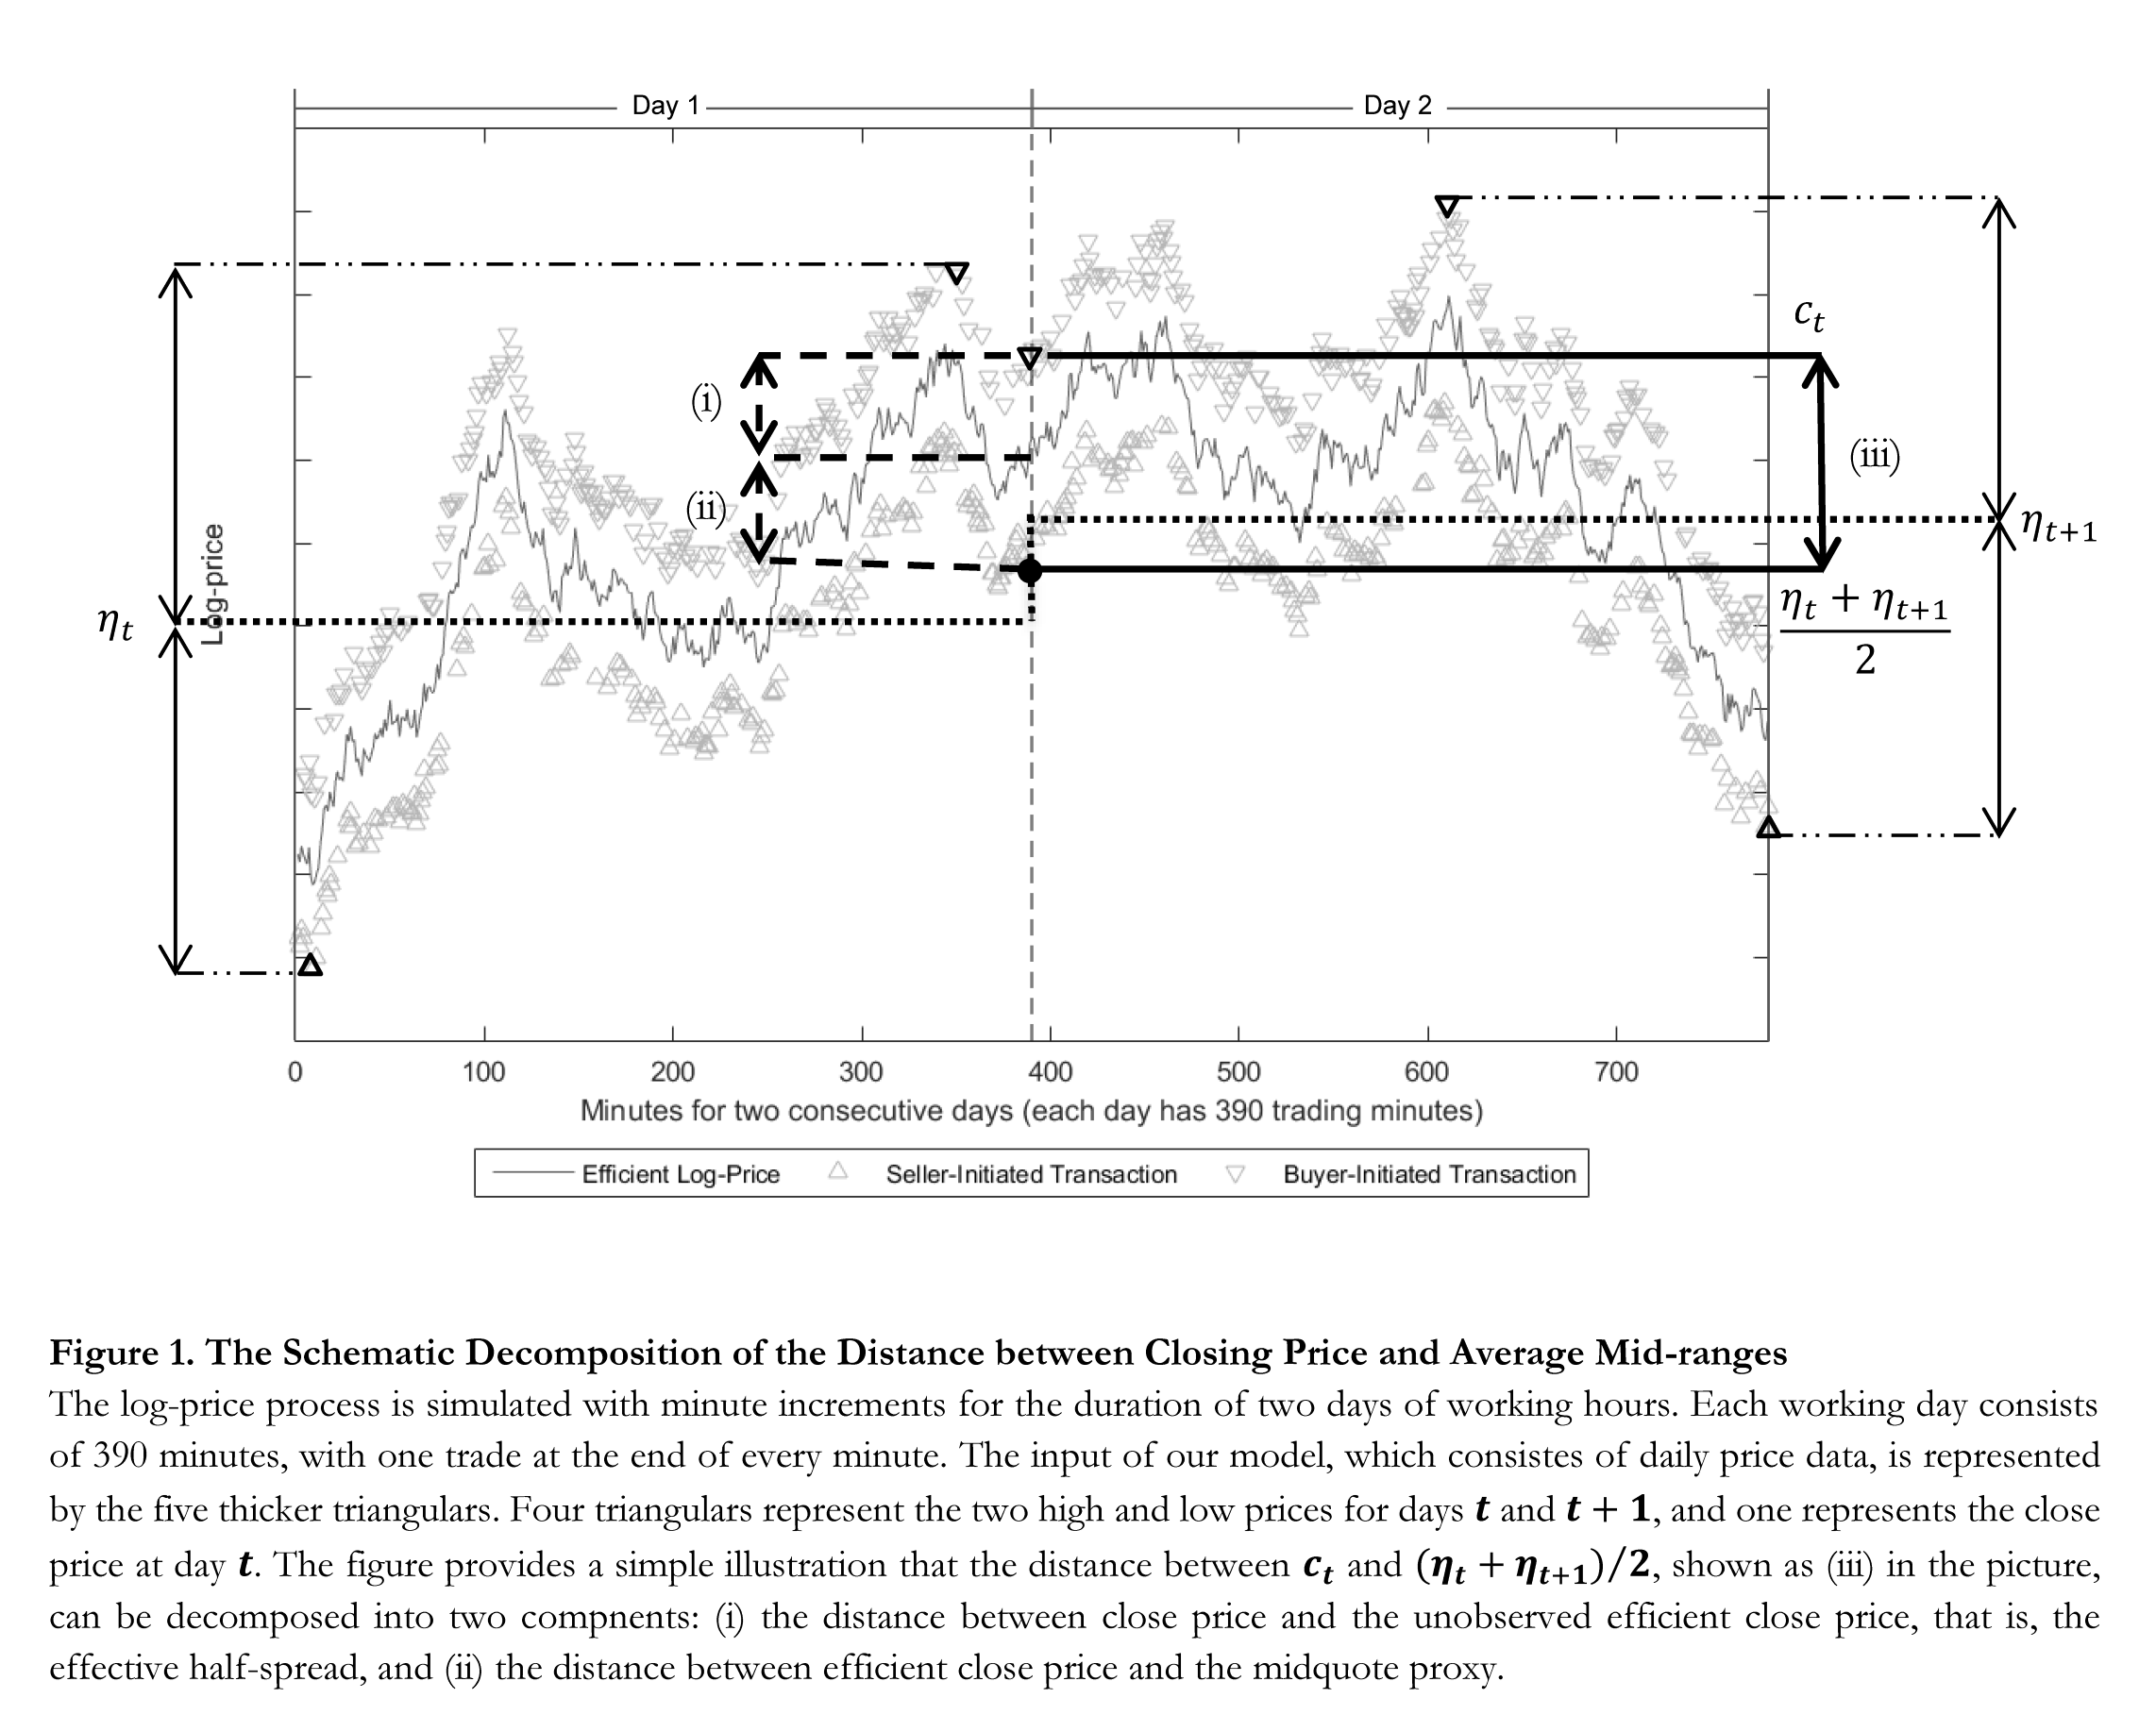
A Simple Estimation of Bid-Ask Spreads from Daily Close, High, and Low Priceswith Angelo Ranaldo
Review of Financial Studies, Volume 30, 4437–4480, 2017
Internet
Appendix | SAS Code to Generate the
Estimates*
We propose a new method to estimate the bid-ask spread when quote data are not available. Compared to other low-frequency estimates, this method utilizes a wider information set, namely, readily available close, high, and low prices. In the absence of end-of-day quote data, this method generally provides the highest cross-sectional and average time-series correlations with the TAQ effective spread benchmark. Moreover, it delivers the most accurate estimates for less liquid stocks. Our estimator has many potential applications, including an accurate measurement of transaction cost, systematic liquidity risk, and commonality in liquidity for U.S. stocks dating back almost one century.
Working Papers
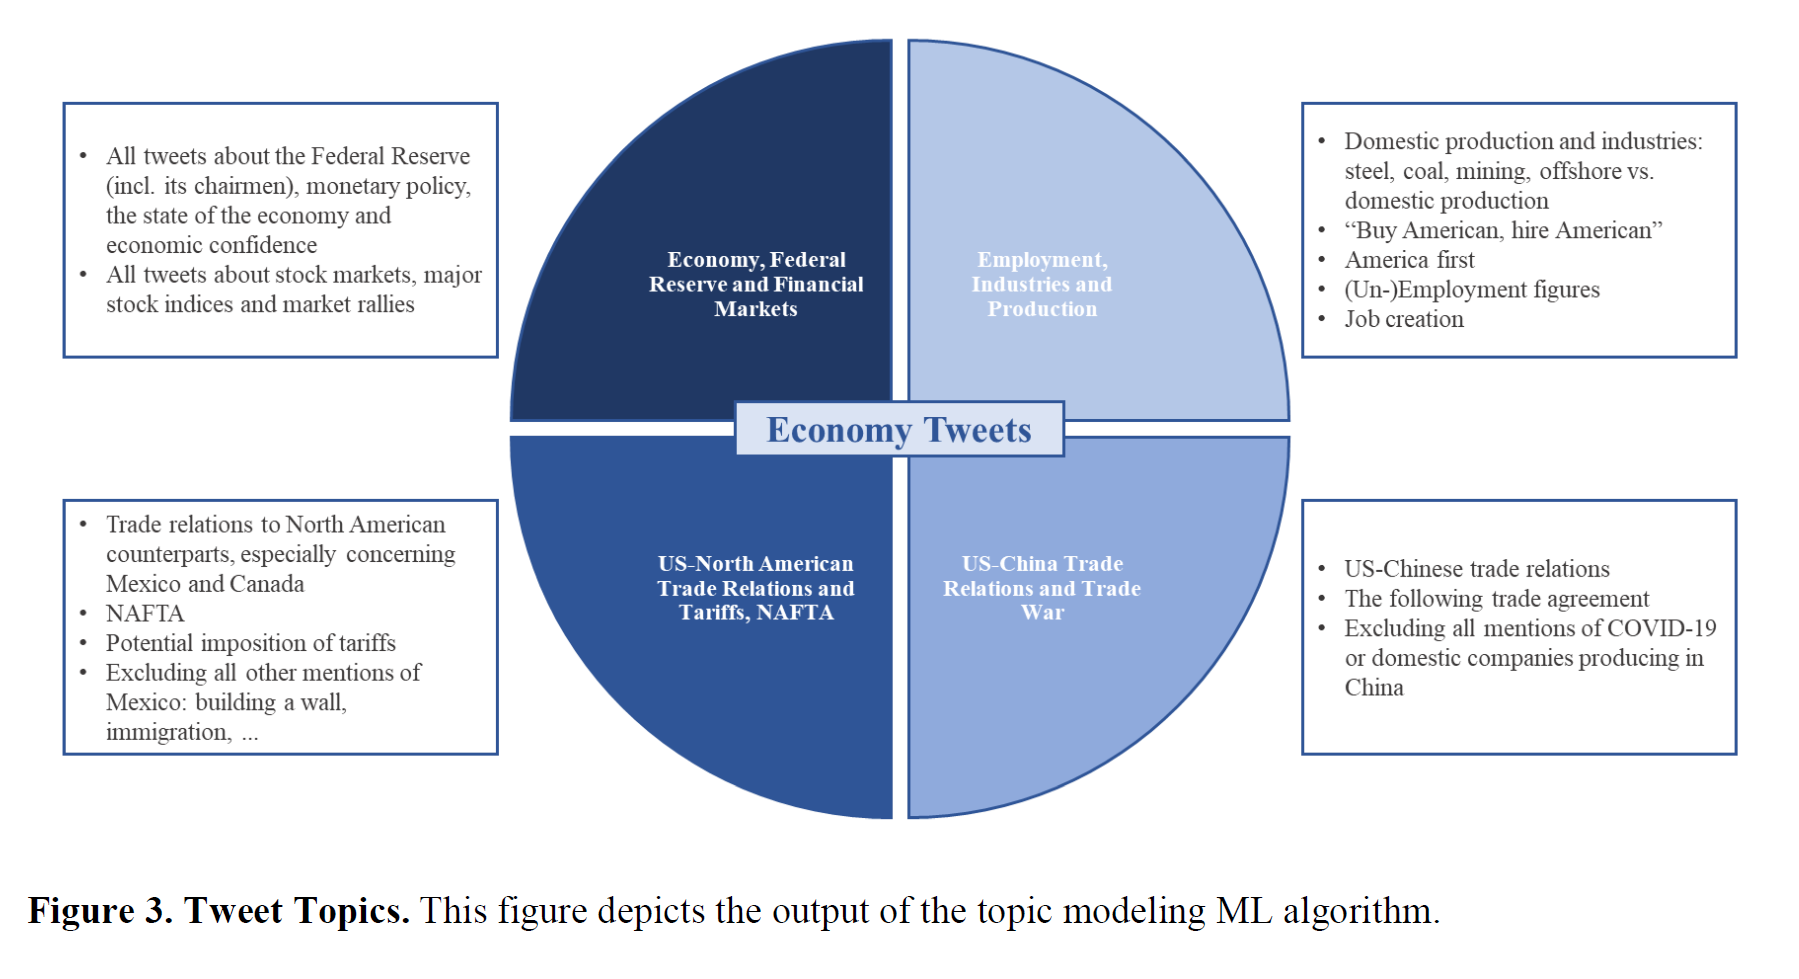
The President Reacts to News Channel of Government Communicationwith Emily Kormanyos, Loriana Pelizzon, and Mila Getmansky Sherman
R&R at Management Science
2022 SGF Conference | 2021 AFML Conference | UMass
Amherst | Goethe University Frankfurt | Cornell University
Statistics Department
Studying about 1,200 economy-related tweets of President Trump, we establish the “President reacts to news” channel of stock returns. Using high-frequency identification of market movements and machine learning to classify the topics and textual sentiment of tweets, we address the observed heterogeneity in the aggregate stock market response to these messages. After controlling for market trends preceding tweets, we find that 80% of tweets are reactive and predictable rather than novel and informative. The exceptions are trade war tweets, where the President has direct policy authority, and his tweets can reveal investable private information or information about his policy function.
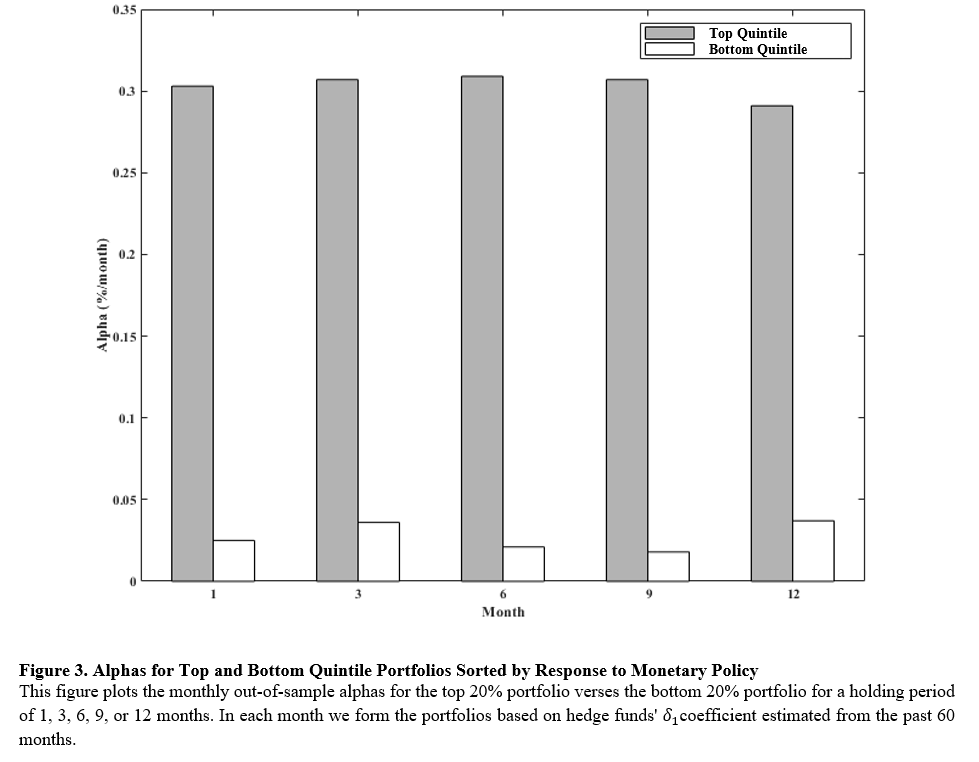
Monetary Policy and Hedge Funds’ Reaching for Betawith Yong Chen and Botao Wu
CUHK (June 2024) | Federal Reserve Bank of Cleveland (August 2024) | Texas A&M University (October 2024)
We uncover that hedge funds adjust their exposure to the equity market in response to monetary policy. Hedge funds decrease (increase) their exposure to the equity market following expansionary (contractionary) monetary policy in the previous month. Hedge funds with stronger response to monetary policy have higher gross and risk-adjusted returns. Hedge funds with higher measures of skills react to monetary policy more strongly. We explain these findings using the Fed Information Effect channel of government communication and rule out some other explanations: Hedge funds utilize the information in the FOMC announcements to update their predictions about the future of the market.
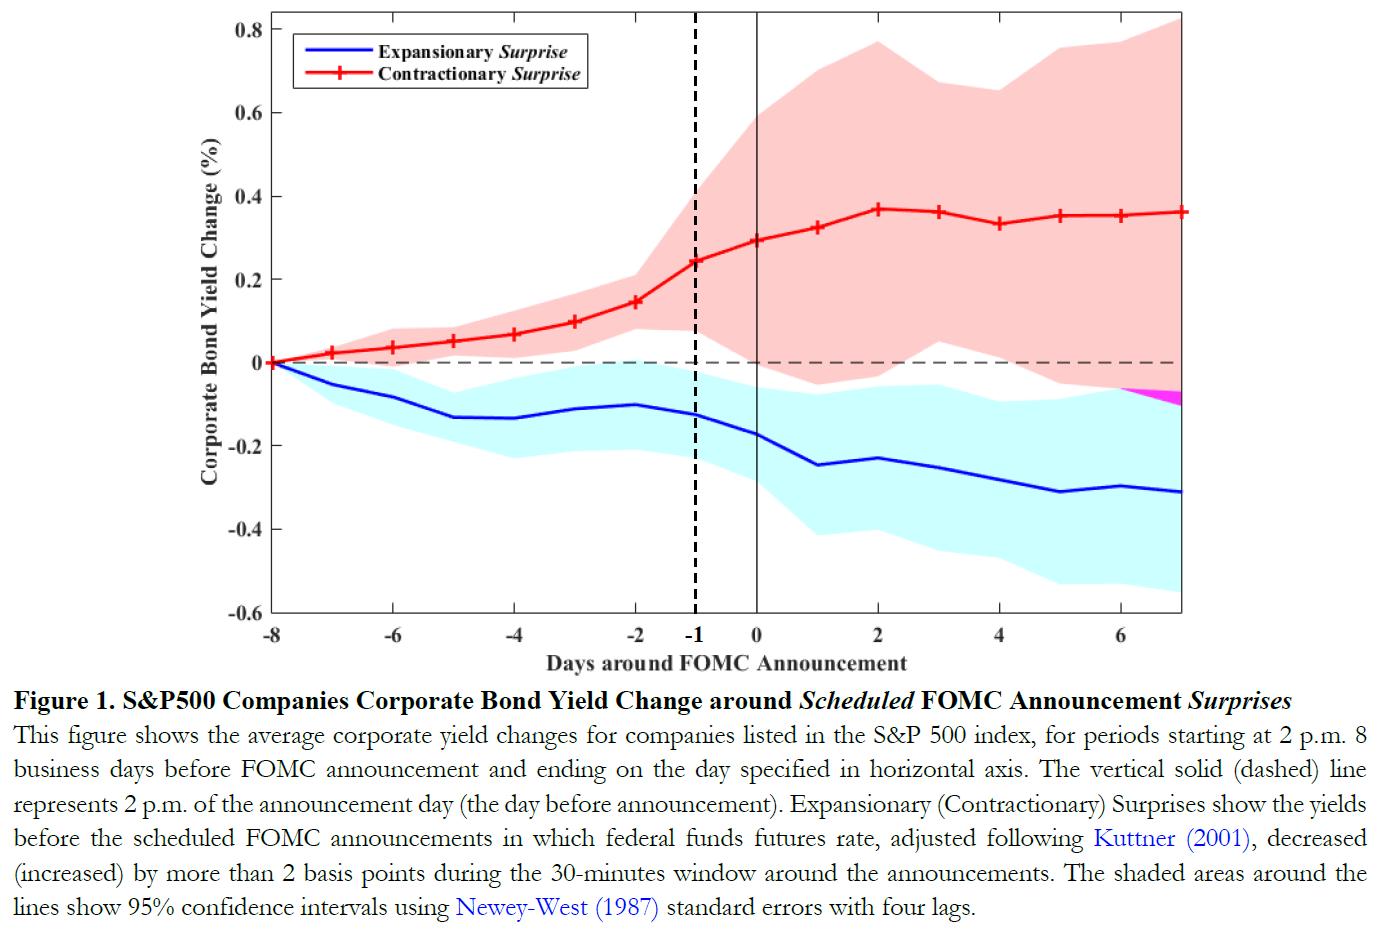
Pre-FOMC Information Asymmetrywith Botao Wu
2023 AFA | 2022 FMA | 2022 YSFC | 2022 E(astern)FA |
2021 AFBC | 8th HK Joint Finance Research Workshop
We uncover informed trading on the days before federal open market committee (FOMC) announcements. We show that this informed trading can explain the pre-FOMC announcement drift in the stock market, by contributing to the resolution of uncertainty before announcement. We document three distinct novel evidences supporting this. First, we show that U.S. corporate bond yield changes in the blackout period before FOMC announcements can predict monetary policy surprises, with about 30% R-squared. Second, and consistent with informed trading, we show that corporate bond customers tend to buy before upcoming expansionary FOMC surprises and sell before contractionary FOMC surprises. Finally, we uncover pre-FOMC information flow from corporate bond to the stock market by showing that (a) corporate bond yield changes Granger-cause stock market pre-FOMC movements, and (b) lagged corporate bond customer-dealer trade imbalances can explain pre-FOMC stock market returns, and the pre-announcement drift.
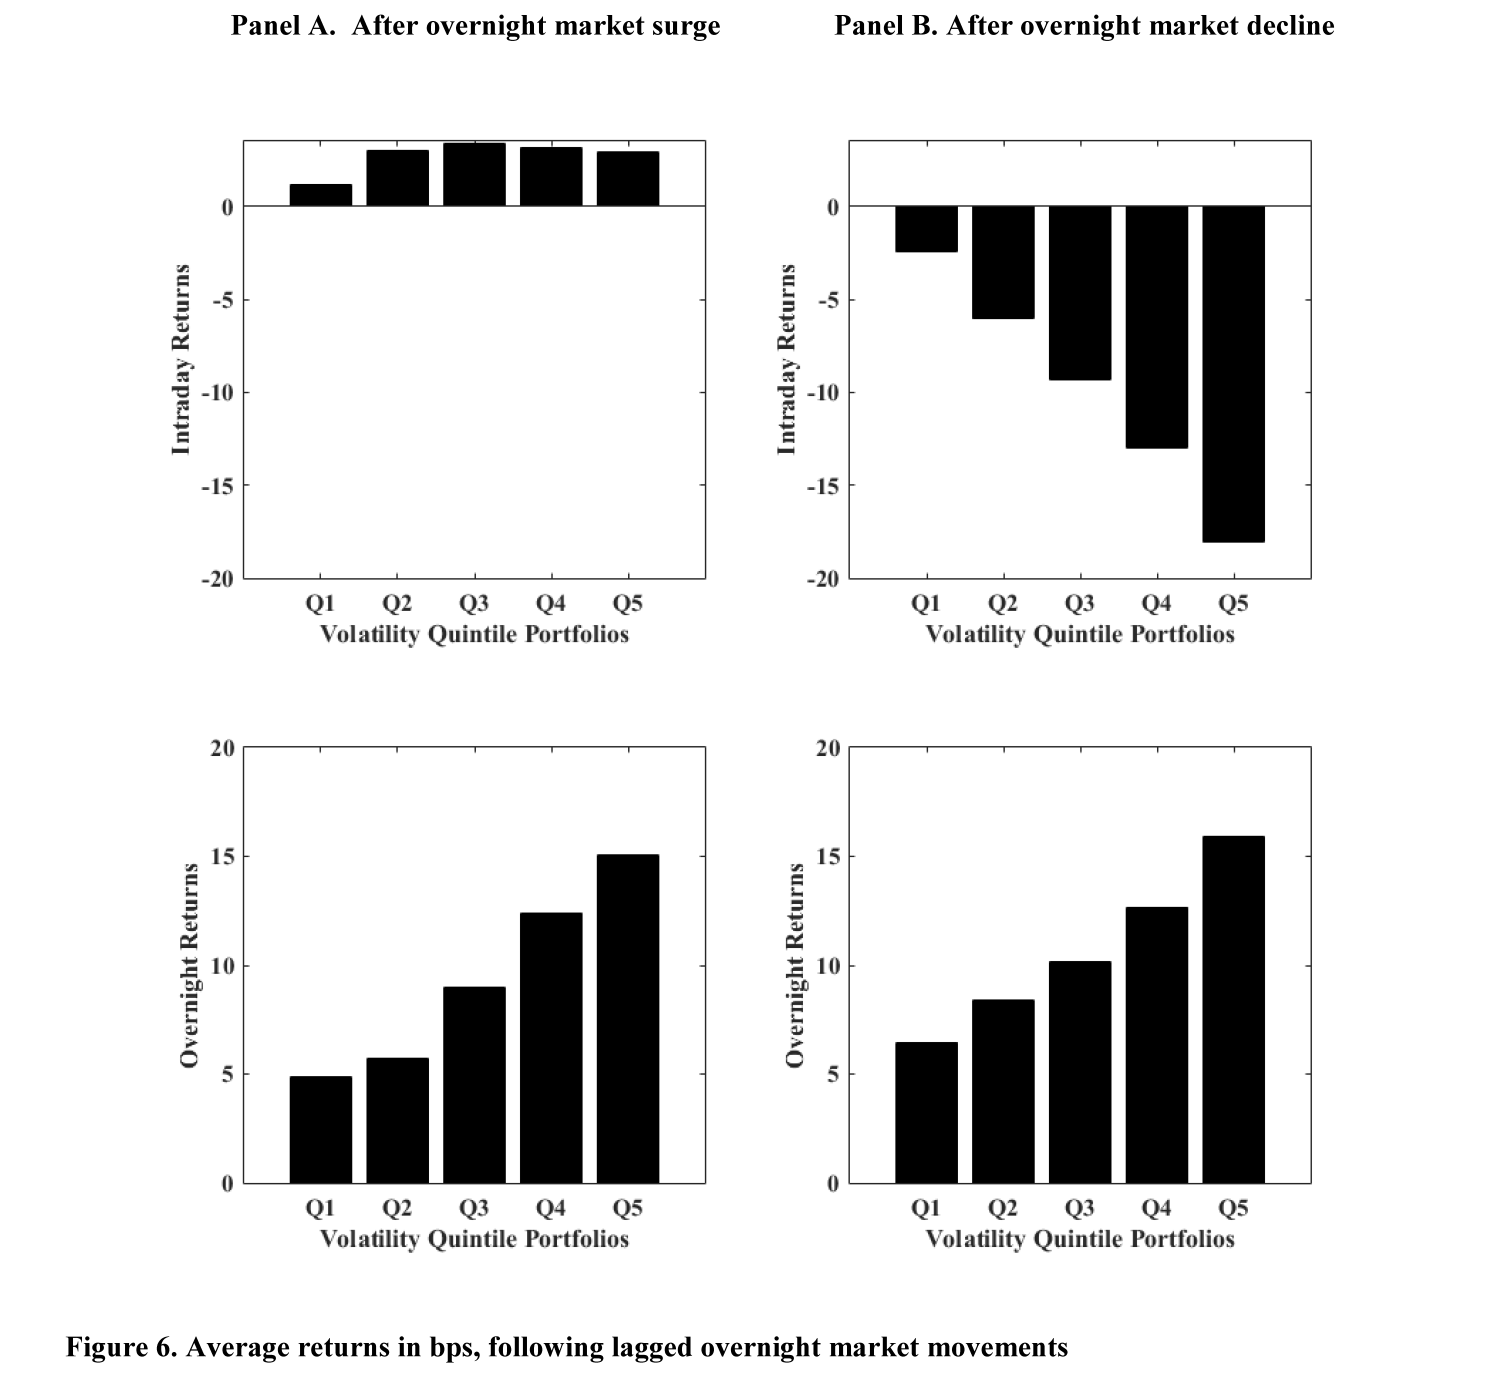
Cycles of Declines and Reversals following Overnight Market Declines
2022 FMA (Best Paper Award Semi-Finalist)
This paper uncovers and explains the emergence of cycles of intraday declines and overnight reversals in the U.S. stock market in the 21st century. Using quote midpoints for the past 24 years of common stocks traded in the three main exchanges, I show that the cross-sectional association between average intraday and overnight returns has steadily shifted from a direct association into a strong inverse association over the years. I explain this shift by showing that after 2001, consistent with theoretical models in which binding capital constraints lead to liquidity dry-ups, an overnight decline in the stock market is followed by a further intraday decline for volatile stocks and their reversal over the next overnight period. Moreover, I show that market liquidity of volatile stocks further deteriorates following an overnight market decline, which confirms my proposed explanation. Finally, I show that idiosyncratic volatility, compared with systematic risk, better explains the cross section of the documented systematic intraday declines and overnight reversals.
* Disclaimer: You use the codes and estimates at your own risk.